WHEN STOCK MARKETS recently crashed, investors pondered whether to cut losses and sell, hold out in hope, or buy more shares while they were cheap.
But could anyone tell which way prices would go? And three months on, what will happen to them next? Perhaps past meltdowns give a hint.
In theory, you can’t predict anything about future prices. They react instantly to news— so before you can figure out which way they might go, they’ve already moved. Thousands of traders and computers beat you to it, so you’re always too late.
On the other hand, big crashes are so rare and extreme that they might behave differently. In a crisis, perhaps enough traders act impulsively, or at least do something unusual, that there’s a bit of a pattern you can make money from.
So let’s look at all crashes that have ever happened in the US and UK, to see if anything is predictable. I’ll use their broad indices, the S&P 500 and FTSE All-Share, and define a crash as a fall of 20% or more within 8 weeks.
UK crashes
Starting with the UK (as its stock market began first), here are all crashes throughout history:
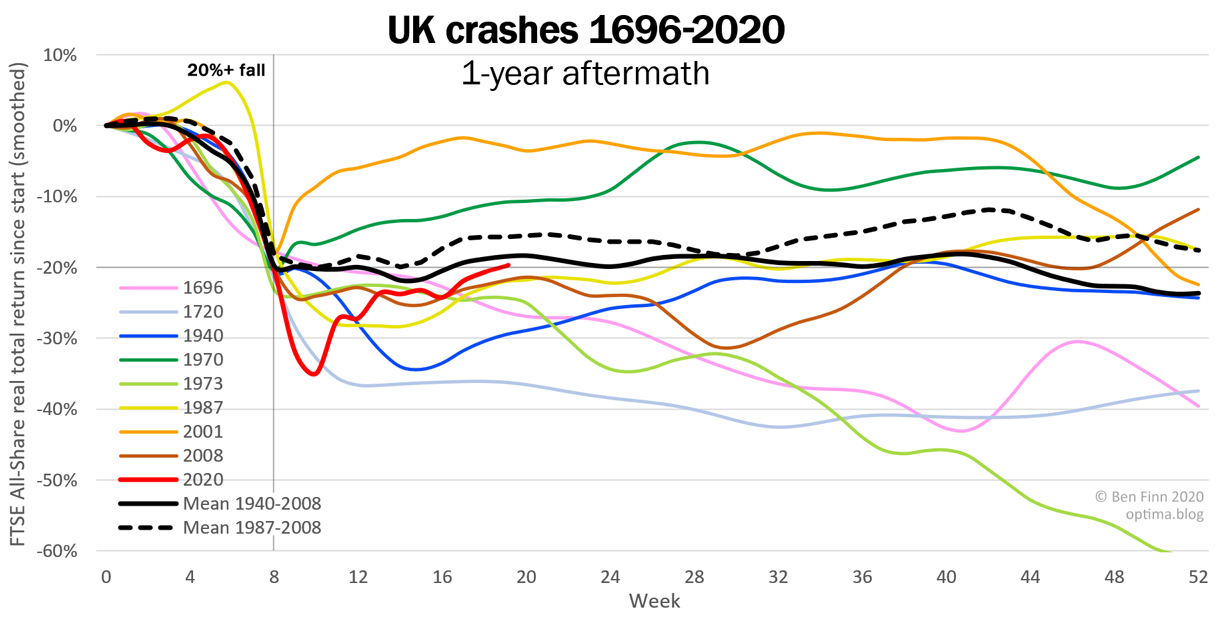
Each coloured line is a crash — starting with a 20% fall — and its aftermath. I’ve even included the Bank of England crisis of 1696, and the still-famous South Sea Bubble of exactly 300 years ago (which coined the term ‘bubble’), though both are omitted from the averages. Thereafter, despite slides and slumps, there were no more actual crashes until World War 2, after which they became more frequent.
The red line is the current crash, from mid-January up to this week. The FTSE fell further, faster, than ever before, then has partly recovered; though this may yet become a dead cat bounce.
Superficially, all these crashes have little in common: caused by speculation, oil, program trading, terrorism, disease; they fall 20% or 70%, take days or years to hit rock bottom, and up to a decade to recover. Like spaghetti, the lines are all over the place.
But to find an underlying pattern, we can simply take an average: the solid black line is the mean of all crashes over the past century. Which shows that after the initial drop, prices are basically flat for the rest of the year. On average, the market didn’t under- or over-react: it neither kept falling, nor bounced or recovered. There is no sign of any trend. So the fact that there was a crash predicted nothing about whether stocks would go up or down, either days or months later; not even by a few percent.
This consistency is surprising. Not least as half these crashes pre-date computers, so there was no automated trading, far less data and number-crunching, and vast scope for biases and iffy strategies.
If we exclude those bad old days, and average the three crashes of the computer era — 1987, 2001 and 2008 — the picture stays much the same (see dashed black line). In week 8, you may as well have tossed a coin to decide whether to buy or sell; for by year end, prices were almost unchanged, on average. And if it looked like you could make a few percent by week 42, consider the huge post-crash volatility and uncertainty; it would be a risky gamble.
US crashes
Across the pond, stock trading didn’t get going until the 19th century. The first meltdown was the famous one, the Wall Street Crash of 1929. This was followed by others, about one per decade — increasingly in sync with UK crashes, due to globalization:

This is similar to, but not quite the same as, the UK chart. For the solid black line shows a gradual rise through the year, somewhat faster than usual (which is 6.6% p.a. for this index). But again, any excess returns probably wouldn’t merit the high risk.
And in any case, the dashed black line suggests this slope was steamrollered by the advent of computers. There’s a bit of a post-crash bounce, but it wasn’t there before 1987, and looks like the random meanderings of later months. Essentially, the line is flat.
So, past US and UK meltdowns give no hint whether to buy, hold or sell. Like a goldfish bumping into the side of its bowl, indices instantly forget they’ve crashed, and just carry on as normal.
If you found this article half-interesting, please share or subscribe below.